Background
This study was for Fidelity. I had been working with a product group for several months, and in both lab and quant studies, there was evidence that some of our participants had not accurately identified their account statuses in recruit screeners. The discrepancy was calling into question the reliability of our recruiting methods—and ultimately, the data collected in the studies.
The team had come up with a work-around to conducting studies with target customer groups that was expensive and time-consuming, but it was unclear if all that extra effort was really necessary. The aim of this study was to quantify users’ ability to correctly self-identify:
- the service model in which they participated (1:1 advisor relationship vs. access to a team of advisors), and
- whether they had a particular type of account with Fidelity or not.
My hope was that the study would yield valuable insights about the client base as well as providing a roadmap for reliable recruiting in future studies.
Process
Much of the study design was straightforward. I would distribute a Qualtrics survey to six different customer groups with questions on which service model and accounts they had, then compare the responses to Fidelity’s internal data for each respondent. The goal was to reach 100 completes per group, so that findings would hold up to statistical analysis.
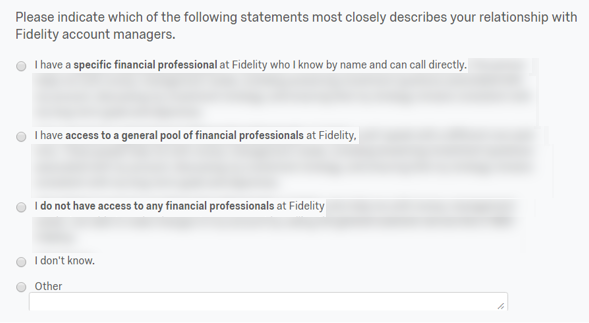
Service-mode question. I would compare respondents’ self-report to Fidelity’s data to gauge accuracy.
The challenge with set-up was in understanding the limitations of the customer lists available to user researchers at Fidelity. I had learned that some critical data fields reflect values for an entire household rather than for the individual. For example, an entry for Jane Smith may actually display her spouse’s age and account status if her spouse had longer tenure as a Fidelity customer. The standard lists also exclude the customers’ assigned service models.
The internal data had to be clean and thorough, so I worked with the customer insights team to create a set of new, custom lists that fit the bill. This unconventional step added more than a week to our timeline for the study, but the research would have been meaningless without it.
I worked with a panel supplier to distribute the surveys to customers on our lists.
After the responses were collected, I tackled the analysis in two ways:
- Correct/incorrect rates by actual status, which would provide insight into how different types of customers perceive their accounts and advisor relationships. These data were analyzed at a 90% confidence level.
- Correct/incorrect rates by participant responses, which would tell us the degree to which we could (or could not) trust self-reported data in recruit screeners. Since we seek very high accuracy when recruiting, a 99% confidence level was applied to this portion of the analysis.

Actual vs. reported values for the service-model question for one of the six groups surveyed. Only 37% accuracy!

Accuracy rates based on participant responses. These data were used to create a recruiting roadmap for future studies.
The net result was a report/presentation that included interesting and actionable findings and recommendations for the design team.
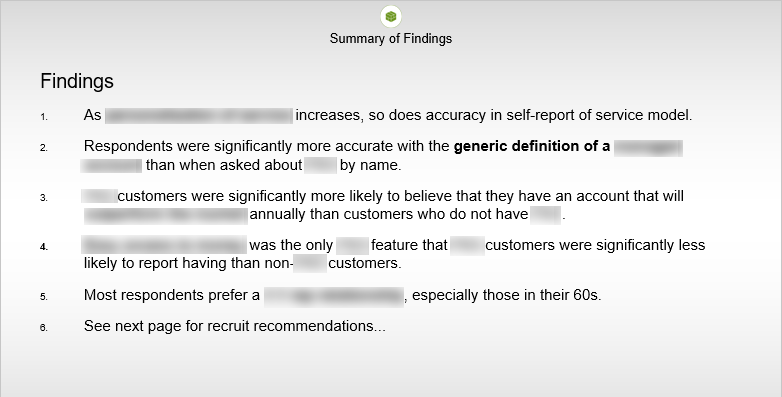
Customer insights derived from the Self-ID study
The second part of the analysis enabled me to compile a roadmap for future recruiting that other researchers and I could (and do, frequently!) consult while planning studies.
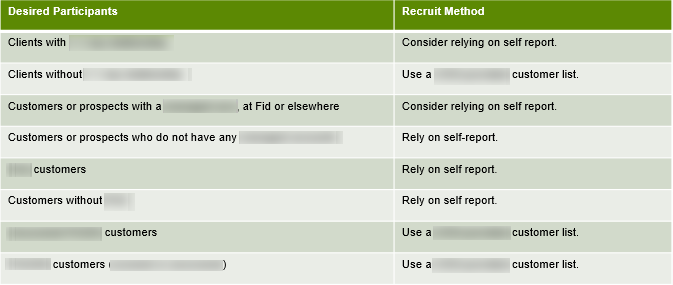
Recruit roadmap based on the degree to which we can trust survey respondents’ self-report
The project team continues to employ the expensive, time-consuming work-around when conducting studies with most of the desired customer groups. However, we now know that this is the right approach and can justify it with data. The additional expense and time required to run studies in this way has been incorporated into project budgets and calendars.
